

Data management & analytics services
Timspark provides data management services that help companies organize, integrate, visualize, and govern business data. Our teams build reliable data pipelines, warehouses, BI dashboards, and analytics solutions for faster, better-informed decisions.
Data management services for cleaner data, faster reporting, and better decisions
From data integration and warehousing to BI dashboards, governance, quality management, and applied observability, Timspark helps companies make data easier to access, analyze, and act on. We work with business and technical teams to build data solutions that support reporting, analytics, automation, and future AI/ML initiatives.
Business intelligence and analytics
Harness the power of BI to uncover insights into operations, market trends, and customer behaviors for your business. Timspark will empower you to make informed decisions that drive success.
Business intelligence and analytics
Harness the power of BI to uncover insights into operations, market trends, and customer behaviors for your business. Timspark will empower you to make informed decisions that drive success.
Data warehousing
Our teams will help you set up a centralized data repository to improve data quality, enable advanced analytics, enhance business intelligence, support scalability, and ensure compliance and security.
Data warehousing
Our teams will help you set up a centralized data repository to improve data quality, enable advanced analytics, enhance business intelligence, support scalability, and ensure compliance and security.
Data quality management
Unlock the full potential of your data assets. Timspark will help you ensure that data is accurate, consistent, and up-to-date, meeting your business’ needs.
Data quality management
Unlock the full potential of your data assets. Timspark will help you ensure that data is accurate, consistent, and up-to-date, meeting your business’ needs.
Data visualization
Transform complex data into clear, interactive visuals that help you identify trends, patterns, and insights to make informed business decisions quickly and effectively.
Data visualization
Transform complex data into clear, interactive visuals that help you identify trends, patterns, and insights to make informed business decisions quickly and effectively.
Data integration
Data integration involves bringing together data from various sources, such as databases, applications, and APIs, and combining it into a unified data set.
Data integration
Data integration involves bringing together data from various sources, such as databases, applications, and APIs, and combining it into a unified data set.
Data governance
Achieve informed decision-making, data quality, compliance, and security, as well as enhanced customer trust via effective frameworks and strategies from our teams.
Data governance
Achieve informed decision-making, data quality, compliance, and security, as well as enhanced customer trust via effective frameworks and strategies from our teams.
Data strategy consulting
Develop a strategic approach to managing and leveraging data assets. With Timspark, you will be able to align data initiatives with your business goals and navigate technological advancements.
Data strategy consulting
Develop a strategic approach to managing and leveraging data assets. With Timspark, you will be able to align data initiatives with your business goals and navigate technological advancements.
Developing company data foundations
Timspark will assist you in establishing a robust data infrastructure for effective storage, organization and analysis of your data and generating near-term value.
Developing company data foundations
Timspark will assist you in establishing a robust data infrastructure for effective storage, organization and analysis of your data and generating near-term value.
Data security and privacy
We ensure that your data is protected from unauthorized access and used in a way that is compliant with all the relevant international regulations.
Data security and privacy
We ensure that your data is protected from unauthorized access and used in a way that is compliant with all the relevant international regulations.

Business intelligence and analytics
Create BI dashboards and analytics workflows that connect operational, financial, sales, and customer data. Timspark helps teams track KPIs, identify trends, and make decisions based on reliable reports.

Data visualization
Turn complex datasets into clear dashboards, charts, and self-service reports. We work with tools such as Power BI, Tableau, Looker, Qlik Sense, QuickSight, and Pyramid Analytics to make business data easier to use.

Data strategy consulting
Define how data should be collected, stored, governed, and used across your business. We assess your current data landscape, prioritize high-value use cases, and prepare a roadmap for analytics, automation, and reporting.

Data warehousing
Design or modernize centralized data warehouses and data lakes that improve data quality, reporting speed, scalability, security, and compliance readiness.

Data integration
Connect databases, applications, APIs, cloud services, and third-party platforms into consistent data flows for reporting, analytics, and operational use.

Developing company data foundations
Set up the architecture, pipelines, data models, access layers, and documentation needed for reliable analytics and future AI/ML use cases.

Data quality management
Detect duplicates, inconsistencies, missing values, and outdated records. Improve data accuracy, consistency, and usability across reporting and business workflows.

Data governance
Introduce ownership, access rules, documentation, lineage, and quality controls so teams can use data safely, consistently, and transparently.

Data security and privacy
Protect sensitive business and customer data with secure storage, access control, auditability, and compliance-oriented engineering practices.

Timspark has been acknowledged as TOP-4 Business Intelligence company and service providers by ReVerb

GoodFirms
Trusted Research Partner
Applied observability for faster business decisions
By 2026, observability has moved beyond IT monitoring: industry data shows that mature observability practices help teams detect issues faster, reduce outage impact, and act on business-critical signals sooner — directly supporting faster decision-making across business and IT processes.
Applied observability turns operational data, metadata, logs, metrics, user actions, and business events into signals your teams can act on. Timspark helps connect the data sources, pipelines, dashboards, and alerting layers needed to move from passive monitoring to proactive decision-making.
*According to Gartner (Top Strategic Technology Trends 2023 Report) by 2026, 70% of organizations that successfully applied observability will achieve shorter latency for decision making, enabling competitive advantage for target business or IT processes.
01
Move from isolated monitoring to connected, observable data flows
02
Use dashboards, alerts, and metadata to reduce decision-making latency
03
Build the data foundation for proactive planning, reporting, and operational improvement
Applied observability for faster data-driven decisions
Applied observability helps companies move from passive reporting to proactive decision-making. Timspark helps teams connect operational data, metadata, logs, metrics, and business events into observable data flows, so they can detect issues earlier, improve reporting reliability, and react faster to changes in business or IT processes.
Improve reliability of reports
Improve system performance and data visibility
Leverage data visualization
Identify patterns and trends in data
Optimize data processing
Realize data clustering
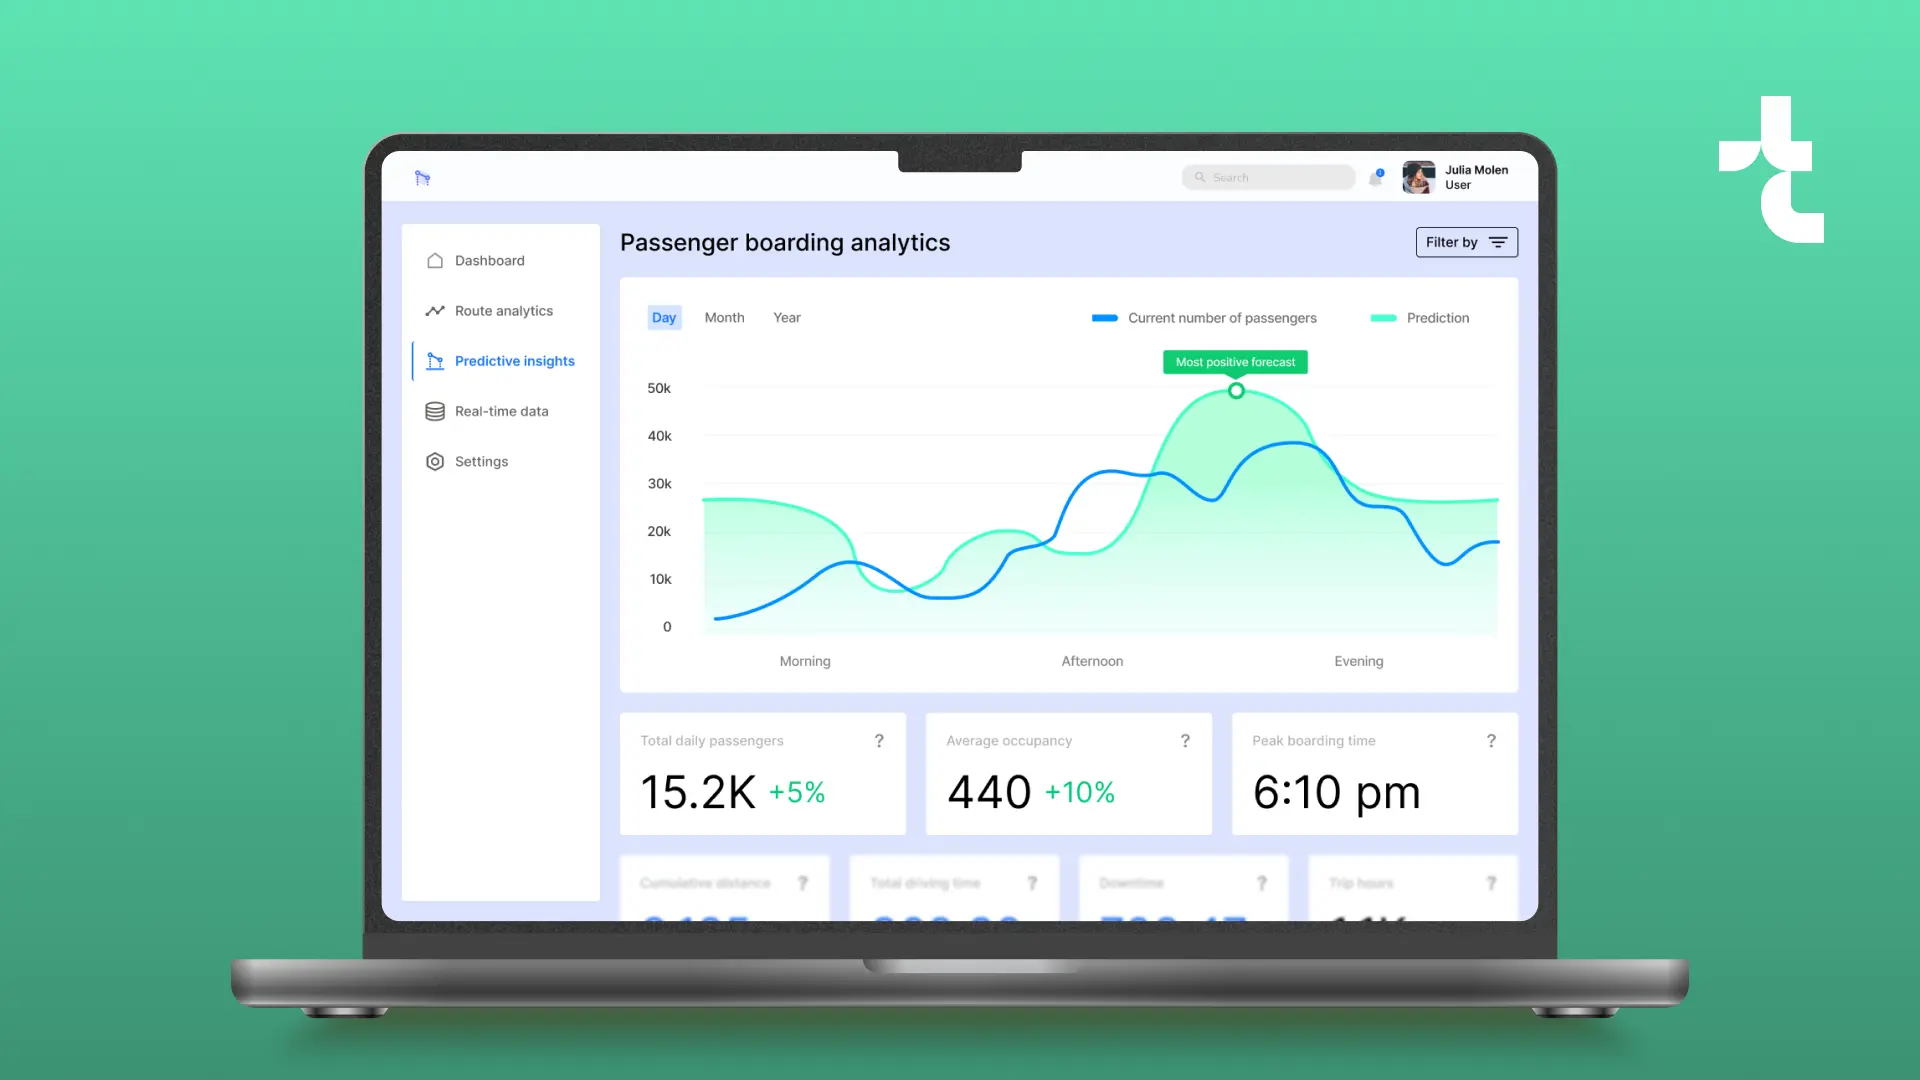
Data visualization services and BI dashboards
Timspark builds custom data visualization solutions that turn complex business data into clear dashboards, reports, and interactive analytics tools. Our dedicated teams help companies track KPIs, monitor operations, identify trends, and make faster decisions using reliable BI and visualization platforms.

What we help visualize:
business performance, sales and revenue data, customer behavior, operational metrics, financial reports, supply chain data, product analytics, marketing performance, and risk indicators.
For the tool descriptions, I’d make them more service-oriented:
Tableau
We use Tableau to build interactive dashboards, executive reports, and self-service analytics environments for teams that need flexible and scalable BI.
Why choose Tableau
- Quick adoption with self-service BI and no-code approach
- Flexibility with fitting any database,integrations with Salesforce and Slack
- Rich set of visualization options, including charts, graphs, maps, and dashboards
- Advanced analytics features, including forecasting, statistical modeling, and trend analysis for deeper insights and make data-driven predictions
- Enterprise-grade security and governance models to keep data in the right hands at all times
Qlik Sense
Qlik Sense is a strong fit for self-service analytics, allowing business users to explore large datasets and create custom reports with less dependency on IT teams.
Why choose Qlik Sense
- Collaborative analytics enabling teams to share and collaborate on insights
- Drag-and-drop functionality for interactive visualizations
- Dynamic storytelling for combining multiple visualizations and narratives into a single, interactive presentation
- Smart search functionality and Natural Language Processing
- Scalability, providing accommodation of large volumes of data and supporting enterprise-level deployments
Looker
Looker helps companies create governed analytics experiences using SQL-based data models, making it suitable for teams that need consistent metrics across departments.
Why choose Looker
- Seamless integration of data visualizations and insights into other applications, portals, or workflows
- Customization features, allowing users to extend and customize the platform according to their specific needs
- Collaboration feature, allowing users to annotate, comment, and collaborate on specific data points
Power BI
Power BI is a practical choice for companies working within the Microsoft ecosystem. It supports interactive dashboards, advanced analytics, natural language querying, and easy report sharing.
Why choose Power BI
- Does not require any coding skills
- Supports both on-premises and cloud-based data sources
- Data transformation capabilities, allowing users to clean, shape, and model data for analysis
- Mobile apps for iOS and Android devices, enabling users to access and interact with dashboards and reports on the go
- Possibility to extend the tool with ML / AI
Pyramid Analytics
Pyramid Analytics supports the full analytics lifecycle, from data discovery and modeling to reporting and no-code analytics workflows.
Why choose Pyramid Analytics
- Smooth implementation, management and support
- Advanced analytics functionalities, including predictive analytics and machine learning
- Robust security features and data encryption that enable protection of sensitive information
- Support of data governance and compliance with regulations
Portfolio of related projects

Why choose Timspark for data management and analytics services
Timspark combines data engineering, BI, cloud, and software development expertise to help companies build reliable data systems, not just isolated dashboards. Our teams can support strategy, architecture, implementation, visualization, optimization, and long-term maintenance.

Data engineering expertise
We design data pipelines, warehouses, integrations, and reporting layers that help teams work with accurate and accessible data.
BI and visualization focus
We build dashboards and analytics tools that make KPIs, trends, risks, and operational performance easier to understand.

Cloud and modern data stack experience
Our teams work with cloud platforms, data warehouses, BI tools, and processing frameworks used in modern analytics environments.

Custom solutions, not templates
We adapt data architecture, dashboards, and governance processes to your business logic, systems, and reporting needs.

Flexible cooperation models
Work with a dedicated data team, extend your internal team with specific specialists, or involve Timspark for a full-cycle data project.
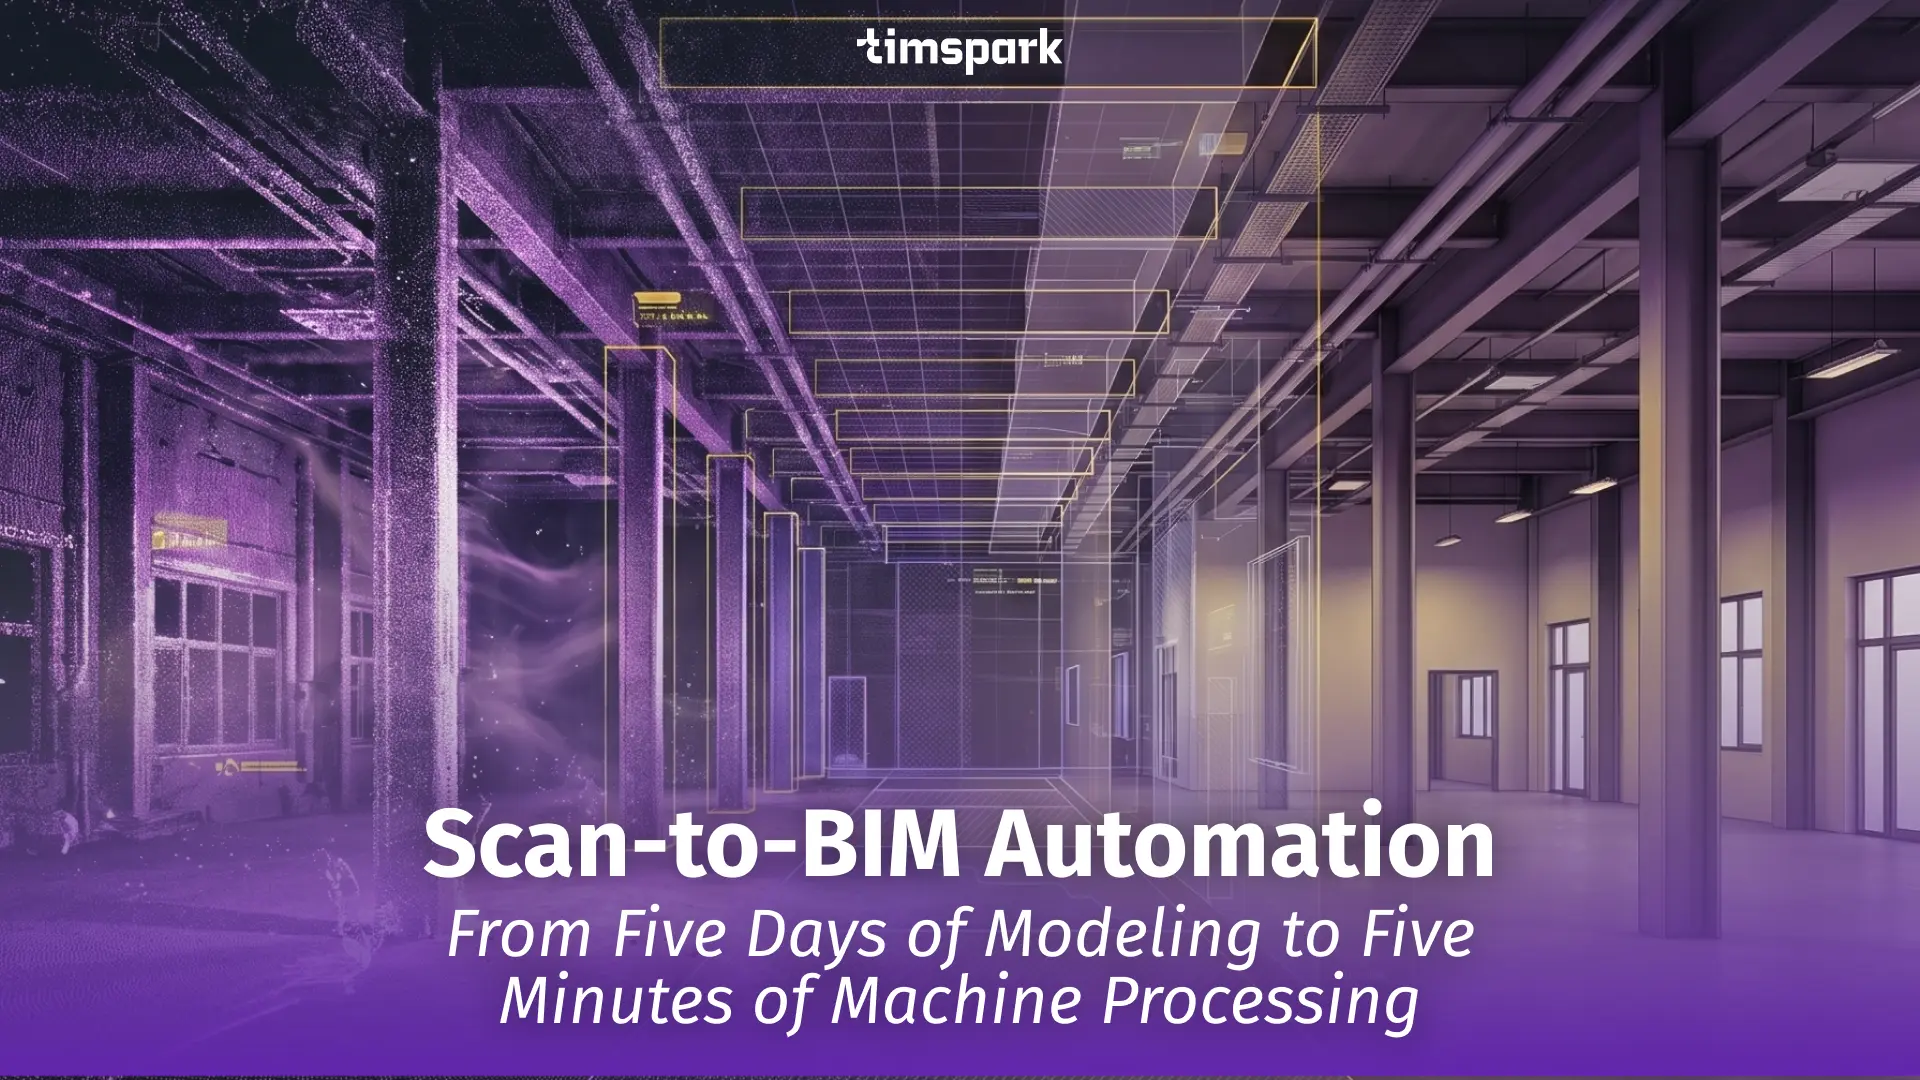
Scan-to-BIM Automation: From Five Days of Modeling to Five Minutes of Machine Processing

Behind the Hype of Vibe Coding: Turning Ideas Into Dream Products
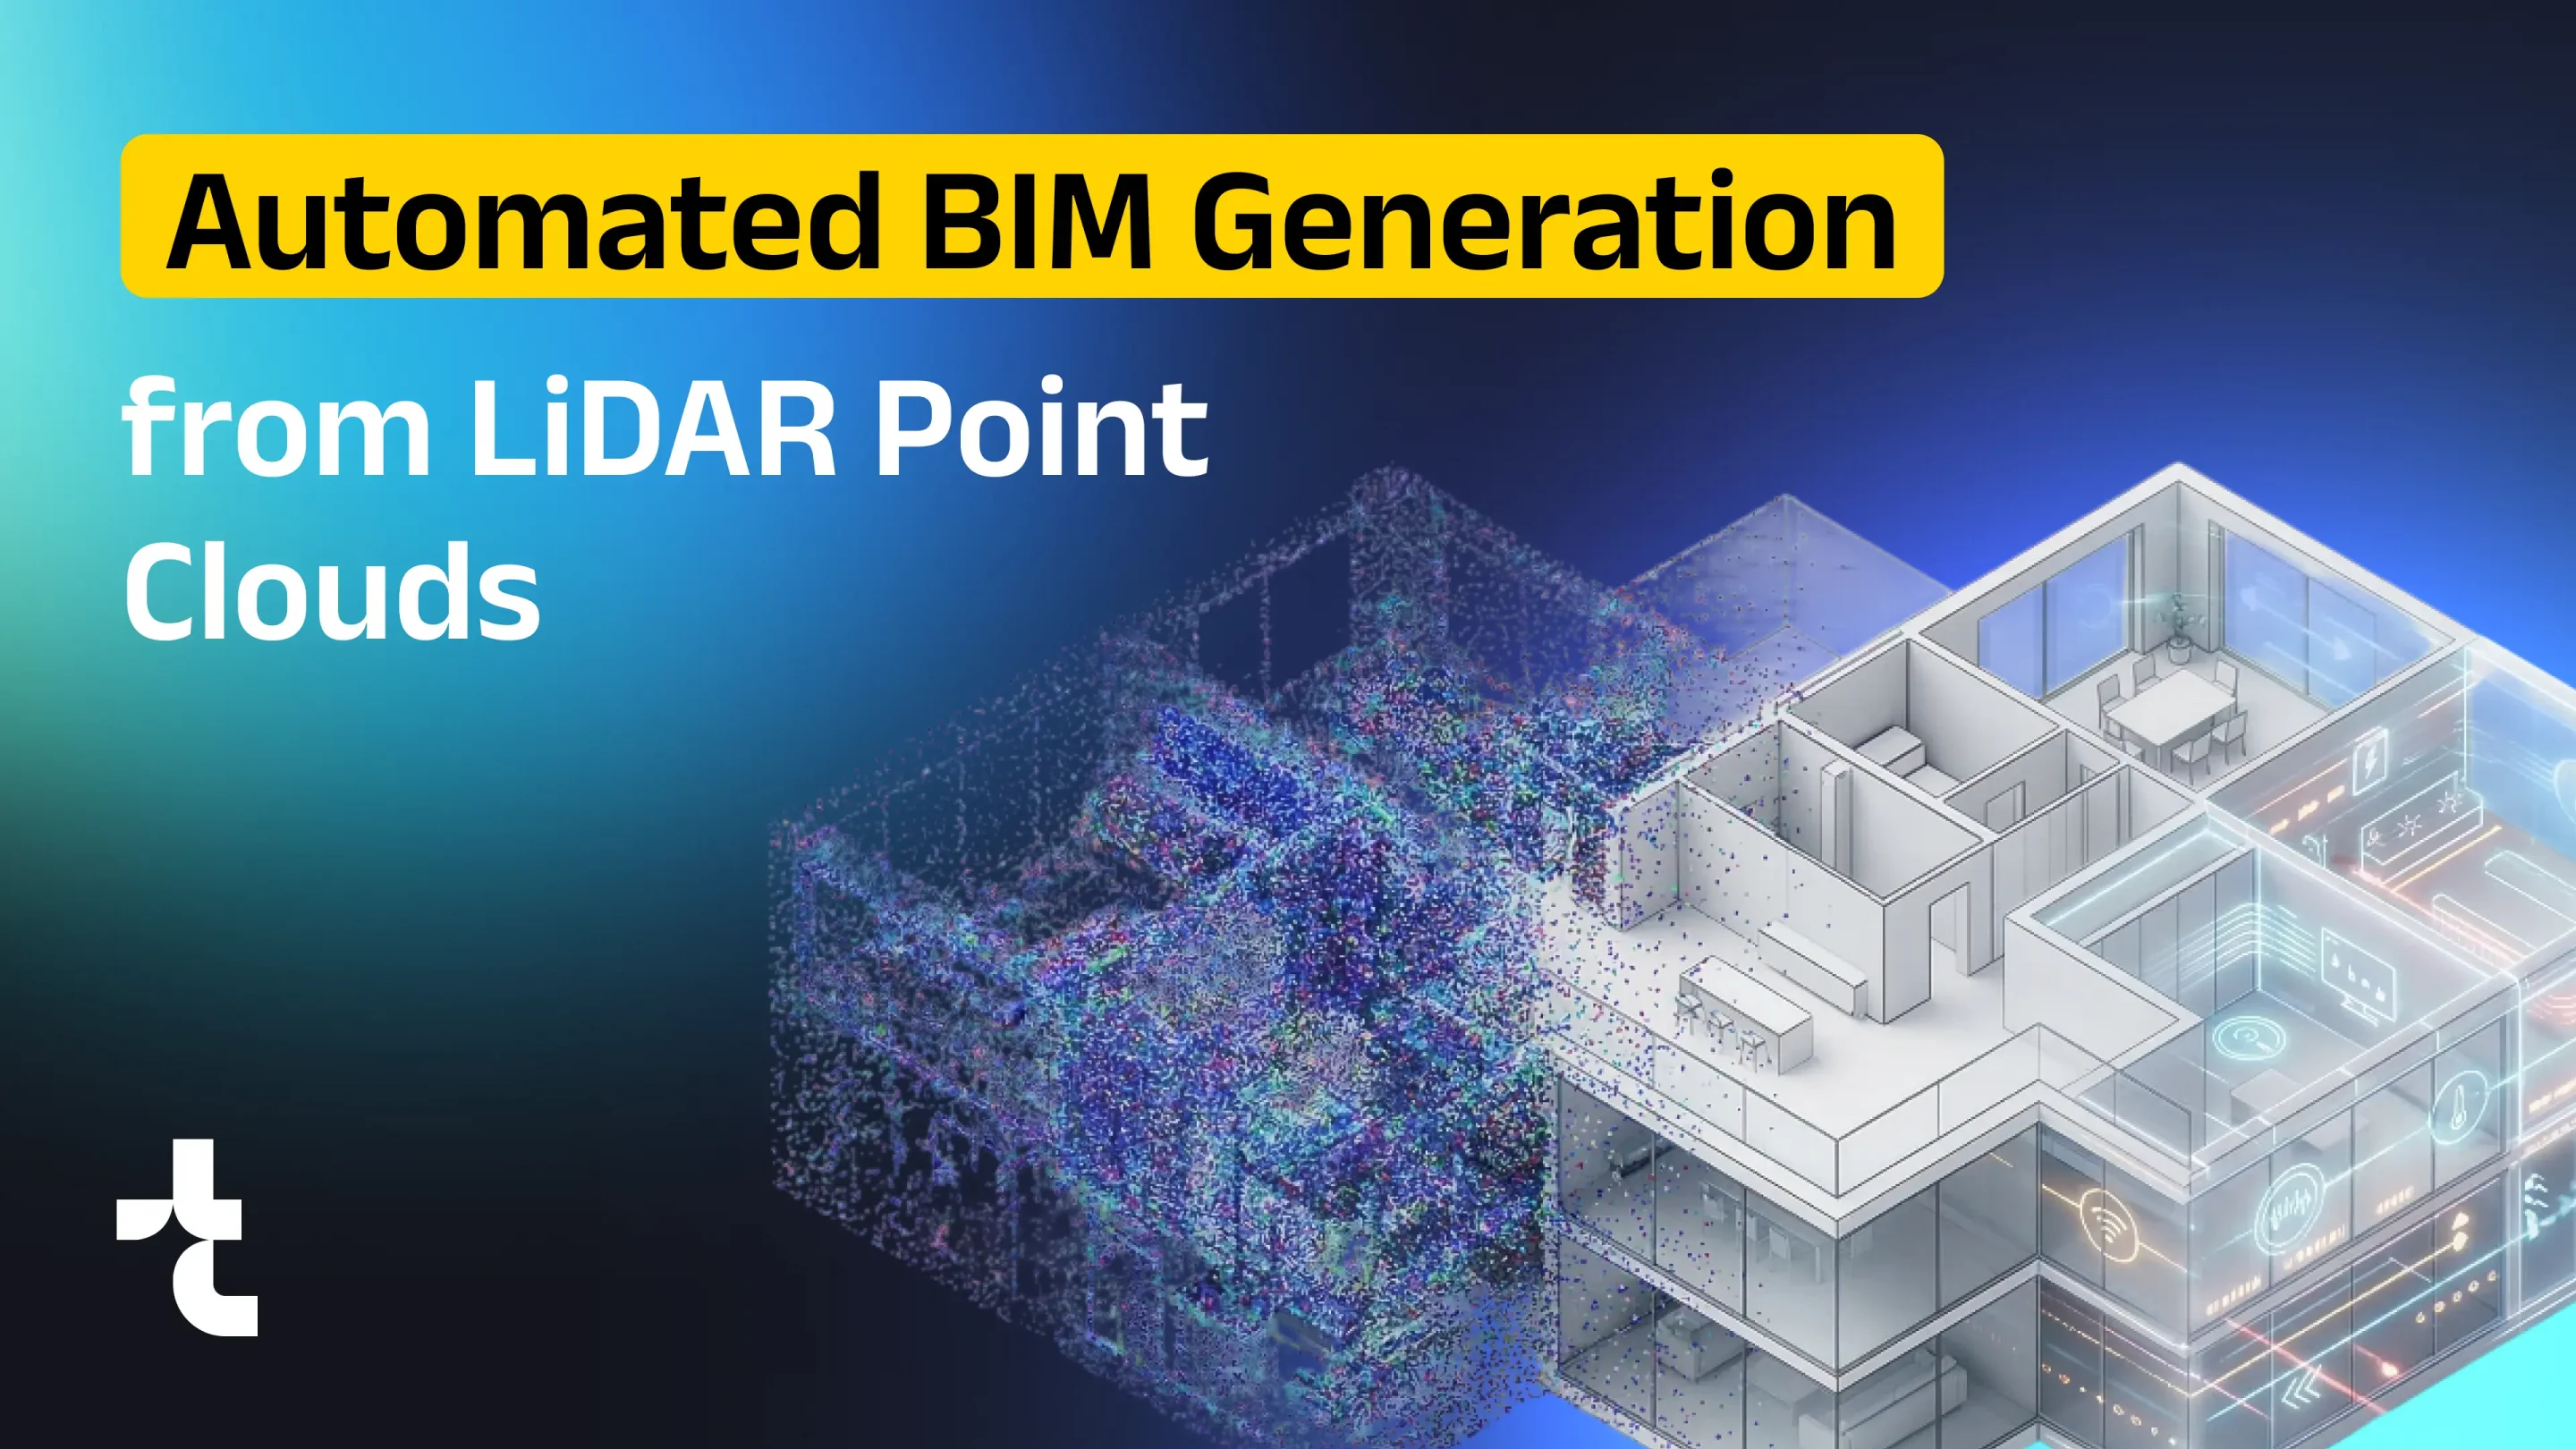
Automated BIM Generation from LiDAR Point Clouds
FAQ
Do you have questions related to data management services?
What are data management and analytics services?
Data management and analytics services help companies collect, organize, integrate, store, govern, visualize, and analyze business data. The goal is to make data reliable, accessible, and useful for decision-making.
When does a company need data management consulting?
A company usually needs data management consulting when data is scattered across systems, reports are inconsistent, dashboards are slow or unreliable, or teams cannot easily access the information they need..
What BI and data visualization tools does Timspark work with?
Timspark works with tools such as Power BI, Tableau, Looker, Qlik Sense, QuickSight, Pyramid Analytics, and other BI and visualization platforms depending on the client’s needs.
Can Timspark modernize an existing data platform?
Yes. Timspark can assess the current data architecture, improve pipelines, optimize storage, redesign dashboards, introduce governance, and migrate or modernize legacy reporting systems.
Can data management services support AI and machine learning projects?
Yes. Reliable data foundations are often required before AI and ML initiatives can work effectively. Clean, structured, well-governed data improves the quality of analytics, automation, forecasting, and AI-based decision-making.
Get in touch with us
Book a call or fill out the form below and we’ll get back to you once we’ve processed your request.
What happens next?
An expert contacts you after thoroughly reviewing your requirements.
If necessary, we provide you with a Non-Disclosure Agreement (NDA) and initiate the Discovery phase, ensuring maximum confidentiality and alignment on project objectives.
We provide a project proposal, including estimates, scope analysis, CVs, and more.
We're here to help!

Relationship Manager

Marketing Lead